You’re probably here because you typed cash value life insurance calculator into a search bar after seeing a policy that seemed to do two jobs at once. It promised a death benefit for your family and a pool of money you might use later. If you’re a newly married couple, a parent, or a business professional trying to make smart long-term decisions, that pitch is naturally appealing.
Then the calculator shows up. You enter your age, a premium amount, maybe a death benefit target, and suddenly you’re staring at a neat projection line climbing into the future. It feels concrete. It feels helpful. It also leaves out some of the most important details.
That doesn’t mean calculators are useless. It means they’re best used like a sketch, not a blueprint. A good sketch can help you ask better questions. It shouldn’t be the only reason you buy a permanent life insurance policy.
Table of Contents
- What Is Cash Value Life Insurance
- How a Cash Value Calculator Really Works
- A Step-by-Step Cash Value Calculation Example
- Comparing Different Types of Cash Value Policies
- The Hidden Limitations of Online Calculators
- Cash Value vs Term Insurance Which Is Right for You
What Is Cash Value Life Insurance
A lot of people first meet cash value life insurance when they’re trying to solve a very ordinary problem. They want to protect a spouse, cover a mortgage, make sure children are taken care of, and maybe build something useful for the future at the same time. Permanent life insurance can sound like the elegant answer.

With cash value life insurance, part of what you pay supports the insurance itself, and part may build value inside the policy over time. That’s what separates it from term life insurance, which usually focuses on protection only. The idea is simple enough: while the policy stays in force, the internal value may grow and may be available through loans or withdrawals, although using it can reduce both cash value and death benefit, as explained by Annuity.org’s overview of cash value access.
What makes people pause is the gap between the simple pitch and the messy reality. Cash value isn’t a checking account. It doesn’t grow in a straight line. And the number you see on a basic calculator isn’t the same thing as the amount you could count on in real life.
Practical rule: Treat a cash value policy as a long-term financial contract, not a shortcut savings app with life insurance attached.
That’s why online calculators are so tempting. They promise quick clarity. You want to know whether this policy fits your family, whether the extra premium is worth it, and whether the future value is realistic. Those are smart questions. The calculator can help you start, but it can’t finish the analysis for you.
How a Cash Value Calculator Really Works
A cash value life insurance calculator usually asks a handful of questions and then produces a clean projection. That can feel reassuring, especially if you are trying to decide whether paying far more than term insurance is justified. But the tool is only doing estimate work. It is building a forecast from assumptions, and small changes in those assumptions can lead to very different results years later.
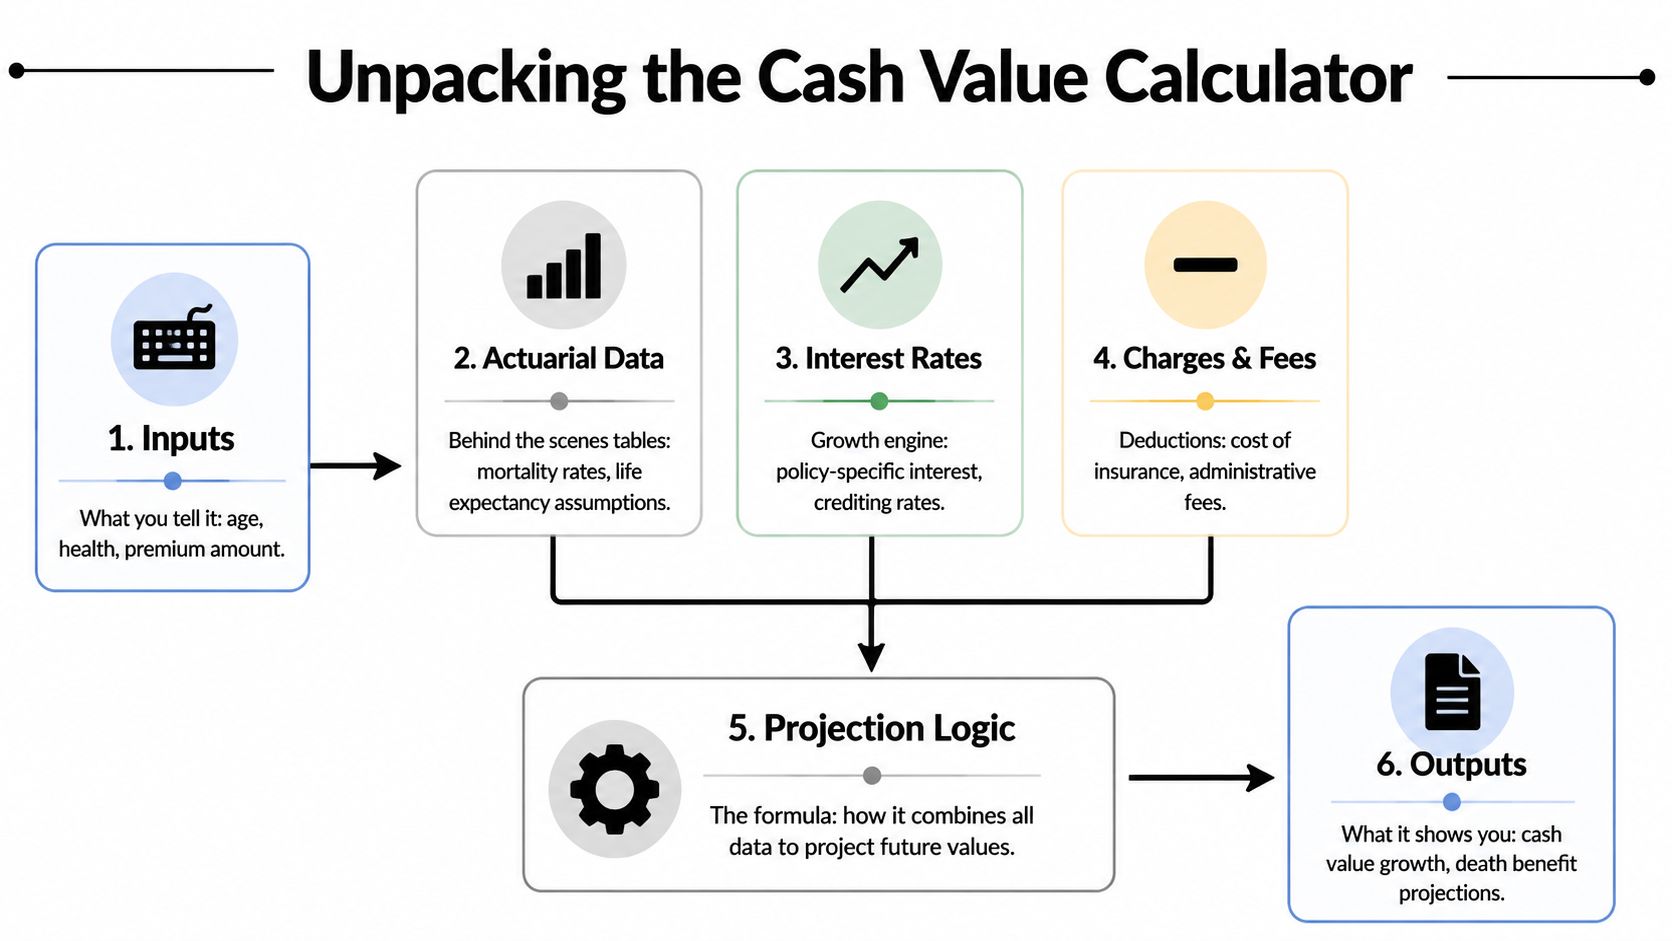
The three buckets inside each premium
The calculation splits money into three basic buckets.
- Premium payments you make. This is the total amount going into the policy.
- Insurance and policy charges. This covers the cost of the death benefit and the insurer’s expenses.
- Cash value growth. This is the portion that may stay in the policy and build over time.
That split matters more than many families expect. Early in a policy, the cash value bucket is often smaller than the sales pitch makes it sound. If you are comparing this with the "buy term and invest the difference" argument, this is the exact pressure point. The higher premium does not go straight into a side account with your name on it. Part of it pays for insurance costs, and part may build value only gradually.
A mortgage is a useful comparison here. Your monthly payment may be large, but only part of it increases equity. Looking at the full payment without separating the pieces can give you the wrong impression about how fast your ownership stake is growing. Cash value insurance works in a similar way.
What the calculator is actually projecting
Most calculators combine your inputs with a growth assumption and then run a year-by-year illustration. The common inputs include your age, policy type, premium amount, death benefit, how long you plan to pay, and sometimes current policy values or loans.
The hidden part is the assumption layer.
A calculator may rely on a credited interest rate, a dividend scale, or an assumed investment return, depending on the policy design. It also has to account for policy charges, which vary by contract and can change the shape of the projection a lot. Whole life, universal life, and variable life do not follow one standard formula, so two calculators can show different outcomes even when you enter the same premium and death benefit.
That is why a calculator does not tell you what will happen. It shows what could happen if its assumptions hold up.
A useful calculator is a simulator, not a promise.
Why online results can feel more certain than they really are
Many public tools are built to simplify, and simplification cuts out details. Some do not show how much of the premium is being absorbed by charges in the early years. Some highlight an attractive long-term value but give less attention to what happens if returns are lower, premiums stop, or policy loans are taken later. For a family trying to judge real financial security, those missing details matter more than the polished chart.
This is also where skepticism helps. If an online calculator makes cash value life insurance look obviously better than term life plus investing the difference, check what it assumed about investment returns, fees, taxes, and payment discipline. A tool can make almost any strategy look superior if the assumptions are tilted enough.
For an existing policy, the more reliable checkpoint is usually an in-force illustration from the insurer. Consumer guidance from the National Association of Insurance Commissioners on reviewing life insurance policy illustrations explains why illustrations should be read carefully and why actual results can differ from projections tied to current assumptions.
A Step-by-Step Cash Value Calculation Example
Sarah is 42, has two kids, and wants coverage that will still be there decades from now. She also wants to know whether the "cash value" part is building something useful for her family or just making the illustration look comforting.

She opens an online calculator. It asks for her age, the policy type, a death benefit, and a monthly or annual premium. If she already owns a policy, she would also want the current cash value, surrender value, and any outstanding loan balance, because those numbers affect what she could access.
Now the part many calculators blur. A permanent policy is doing several jobs at once. Part of the premium pays for insurance. Part goes to fees and policy expenses. Part may build cash value. In the early years, that can feel like filling a bucket with a hole near the bottom. Money is going in, but the visible buildup may be slower than a first-time buyer expects.
Walking through a realistic projection
Say Sarah enters a premium she believes she can keep paying for many years, not just during a good income year. The calculator gives her a chart that starts slowly, then curves upward more noticeably later on. That general shape is common in many permanent policy illustrations, especially for buyers who fund the policy steadily and hold it for a long time.
The point is not the exact future number. The point is timing.
Early on, cash value often lags behind total premiums paid. Later, the growth may look much better on paper. That pattern matters because a policy can be a poor fit for a family that may need flexibility in the first several years, even if the long-run projection looks attractive.
A calculator also will not show opportunity cost very clearly. If Sarah is comparing this to buying term coverage and investing the difference, the honest question is not just, "What could this policy grow to?" It is also, "What am I giving up by sending these dollars here instead of somewhere else?" That is one reason whole life insurance cost estimates matter so much before you take any projection at face value.
Here is the mental model I use with clients. Cash value growth works like planting a tree, not earning interest in a checking account. The first few years can look underwhelming because the roots are forming first. If you keep funding the policy and keep the contract in force, the later years are where the illustration usually starts to look more impressive. If you stop early, the story can look very different.
A visual explanation can help if this pattern still feels abstract:
What to check before you trust the result
A useful review starts with the middle of the illustration, not the final number at the far right of the chart.
How much cash value is available in the first 5 to 10 years
This helps Sarah judge whether the policy gives her flexibility or mainly rewards patience.Which values are guaranteed
Guaranteed values are the floor. Any higher projection may depend on dividends, crediting rates, or market performance that may not show up as illustrated.How stable the premium really is
Some policies are built around fixed funding. Others can become more fragile if assumptions change.What happens if she uses the policy later
Loans and withdrawals can reduce cash value growth and may shrink the death benefit her family would receive.How this compares with a term-plus-investing plan
A fair comparison uses the same discipline, the same time frame, and realistic assumptions on both sides.
That last point builds trust because it forces the calculator to compete fairly. If a tool makes permanent insurance look obviously superior, check what it assumed and what it left out. A calculator is best used to compare scenarios, stress-test assumptions, and spot trade-offs. It is much less useful as proof that one polished projection will become your family's outcome.
Comparing Different Types of Cash Value Policies
Not all permanent policies build cash value the same way. This is one of the biggest reasons a general calculator can confuse people. The label “cash value life insurance” sounds like one product category, but it’s really a family of policy designs.
Cash Value Policy Types at a Glance
| Feature | Whole Life | Universal Life | Variable Universal Life |
|---|---|---|---|
| Premiums | Generally fixed | More flexible | Often flexible |
| Cash value growth | More predictable, often built around guaranteed values and possible dividends | Tied to insurer crediting methods and policy design | Tied more directly to investment performance |
| Risk level | Lower relative risk | Moderate, depending on design | Higher |
| Ease of projecting | Usually easier to model | More assumption-sensitive | Hardest to project with confidence |
| Best fit for | People who value structure and predictability | People who want flexibility | People comfortable with more investment-related uncertainty |
If you’re trying to estimate pricing as part of the bigger decision, this overview of whole life insurance cost gives useful background on how these policies are typically framed.
Why the illustration matters more than the calculator
The engine changes by policy type. Whole life is usually the easiest for consumers to understand because the structure is more rigid. Universal life introduces more moving parts. Variable universal life adds market-related uncertainty, which makes simple projections feel more precise than they really are.
That’s why there is no universal calculation method. As discussed in Lighthouse Life’s explanation of policy-specific cash value calculations, calculators often use year-by-year projection tables that can show guaranteed values beside more optimistic scenarios. In one example, a policy might show $50,000 guaranteed cash value at year 10 but $75,000 in an optimistic dividend scenario, which is a 50% variance.
That gap tells you something important. A single output number can hide a wide range of possible outcomes.
When you compare policy types, don’t ask only “Which one has cash value?” Ask “What drives it, what can change it, and how much uncertainty am I accepting?”
For families, this matters because the wrong kind of confidence can be expensive. If you buy a policy because a calculator made the future look smooth, you may not notice how much of that result depended on assumptions rather than guarantees.
The Hidden Limitations of Online Calculators
This is the part most calculator pages soften or skip. Online tools are often useful for orientation, but they’re weak decision tools. If you treat them like final answers, you can walk into a policy with the wrong expectations.

Why online estimates drift from real policy values
Some sources say the quiet part out loud. Online calculators often provide “ballpark figures” rather than actionable numbers, and one analysis notes that estimates can diverge by 20-40% from actual policy performance because the tools can’t account for health class, carrier-specific caps, or policy design, as explained in Insurance Geek’s discussion of IUL calculator limitations.
That’s a big gap. It means the clean chart on your screen may not reflect the contract you would receive.
Here are some of the reasons:
Health classification can change pricing
Two people the same age can receive different outcomes because underwriting isn’t identical.Carrier design choices matter
Different insurers structure caps, charges, and assumptions differently.Policy design is not cosmetic
The way a policy is funded and built can change long-term performance.Simplified tools often lean optimistic
They may emphasize attractive growth scenarios because those are easier to market.
If you’re trying to understand the tax side of future access, this guide to whether cash value in life insurance is taxable is a useful next question, because the way you access policy value also affects how practical that value really is.
What to ask for before you buy
The answer isn’t to ignore calculators. It’s to use them correctly. Let them help you learn the vocabulary and pressure-test a few broad scenarios. Then switch to documents tied to the actual policy.
Ask for these items:
An in-force illustration or carrier illustration
This is closer to the actual contract assumptions.Both guaranteed and non-guaranteed projections
You want the floor and the hopeful case side by side.A clear explanation of charges and access rules
Cash value on paper and accessible money aren’t always the same thing.
Don’t sign based on the calculator result you like most. Sign only after you’ve seen how the actual carrier illustrates the policy.
That advice may sound less exciting than a shiny projection graph. It’s also much safer.
Cash Value vs Term Insurance Which Is Right for You
This choice gets framed too often as a debate with one winner. That’s not how good planning works. The better question is simpler: what job does the policy need to do for your family?
What job does the policy need to do
If your main goal is income replacement, mortgage protection, childcare continuity, or giving your spouse breathing room if something happens during your working years, term life insurance is usually the cleaner tool. It focuses your dollars on protection.
Cash value life insurance tries to do more than one job. That can be useful for some households. It may offer forced savings, long-term policy value, and the possibility of access later in life. But every “extra feature” competes with affordability.
That’s where many smart buyers get stuck. The policy may be appealing in theory but stressful in practice if the premium stretches the monthly budget. A product isn’t helping your family if it causes cash flow strain or leads to lapses later.
Where the term plus investing debate gets real
The hard question is the one many cash value calculators avoid: is the cash value worth the premium difference compared to term plus investing the difference? According to LSA’s discussion of cash value calculator blind spots, many resources fail to address surrender charges, often 10-15% in early years, or to provide a real breakeven analysis.
That omission matters because young families usually need flexibility as much as they need long-term planning. A policy can look attractive when you focus on projected accumulation and ignore friction.
Here’s the practical way to consider it:
Choose term when affordability and pure protection lead
This is often the strongest fit when your biggest need is covering family risk efficiently.Consider cash value only if the long-term use case is real
You should know why you want permanent insurance beyond “the calculator looked good.”Stress-test liquidity realistically
If you may need access to money early, surrender charges and policy mechanics matter.Don’t ignore opportunity cost
Paying more for a policy means those dollars aren’t available for other goals.
If you want a direct product comparison, this term vs whole life insurance guide is a helpful way to frame the trade-offs without treating one answer as universal.
For many young families, term life is the efficient foundation. Permanent insurance may make sense later or in specific planning situations, but it doesn’t automatically beat simplicity.
The right answer usually isn’t the most complicated policy. It’s the one that protects your family well, fits your budget, and still lets you build the rest of your financial life.
If you want straightforward coverage without getting buried in permanent policy complexity, Coveredly offers digital, flexible life insurance built for real life. For many young families and busy professionals, term coverage is the simplest way to secure a large death benefit while keeping room in the budget for everything else your plan needs to do.