
You've just welcomed a child, signed a mortgage, or combined finances with a partner. Your household budget may already feel carefully balanced, so choosing life insurance can seem simple: multiply your salary by a convenient number, buy the policy, and move on.
A shortcut can miss the obligations your family would still face after your death. A mortgage, education plans, unpaid caregiving, debts, final expenses, and the income your household needs may not fit neatly into a single income multiple. Existing savings and employer coverage matter too, because your family needs the funding gap, not an unnecessarily large gross amount.
Table of Contents
- Introduction Why Guessing Your Coverage Amount Leaves Families Exposed
- What a Life Insurance Needs Analysis Really Measures
- Comparing the Three Most Common Calculation Methods
- Worked Examples That Show the Math in Real Life
- Needs Analysis for Business Owners and Diverse Households
- How to Stress Test Your Coverage With Scenario Planning
- Your Life Insurance Needs Analysis Worksheet and Next Steps
Introduction Why Guessing Your Coverage Amount Leaves Families Exposed
A life insurance needs analysis is a personalized math exercise. It compares the money your household would need with the resources already available to your survivors. The basic question is straightforward: if one income or caregiving role disappeared tomorrow, what would your family need to keep housing, daily life, and long-term goals on track?
The need is broader than many families expect. In 2024, 42% of American adults, about 102 million people, said they needed life insurance or needed more of it, up from 41% in 2023, according to the LIMRA and Life Happens Insurance Barometer study. The same research found that 21% of life insurance owners said they didn't have enough coverage, which means owning a policy doesn't automatically mean the household is protected.
Consider a newly married couple with one strong income, a shared home, and plans for children. A flat multiple might produce a number that looks substantial, yet it may fail to account for the surviving spouse's income, the years children depend on the household, or assets that could reduce the amount needed. A detailed analysis makes each assumption visible instead of hiding it inside a rule of thumb.
Practical rule: A coverage amount should explain what it pays for, how long it lasts, and which resources reduce the gap.
This guide compares three common approaches: the income replacement multiple, the DIME method, and human life value. It then uses side-by-side calculations, a practical worksheet, and scenario planning to show why different methods can produce different answers for the same family. For estate-related decisions, questions about beneficiaries, ownership, and trust arrangements can also make a conversation with an estate professional useful. Tanner Law's lawyer questions for estate planning can help you prepare for that discussion.
What a Life Insurance Needs Analysis Really Measures
A family can appear financially stable today and still face a large gap after one income or caregiving role disappears. A needs analysis measures that gap by listing the costs survivors may face, the support they may need, and the resources already available to them.
The central formula is:
Gross need minus available assets equals net need.
Gross need includes obligations tied to income, housing, debt, education, and final expenses. Available assets may include liquid savings, existing personal life insurance, and relevant employer coverage. Subtracting those resources leaves the amount of new protection the household may need.
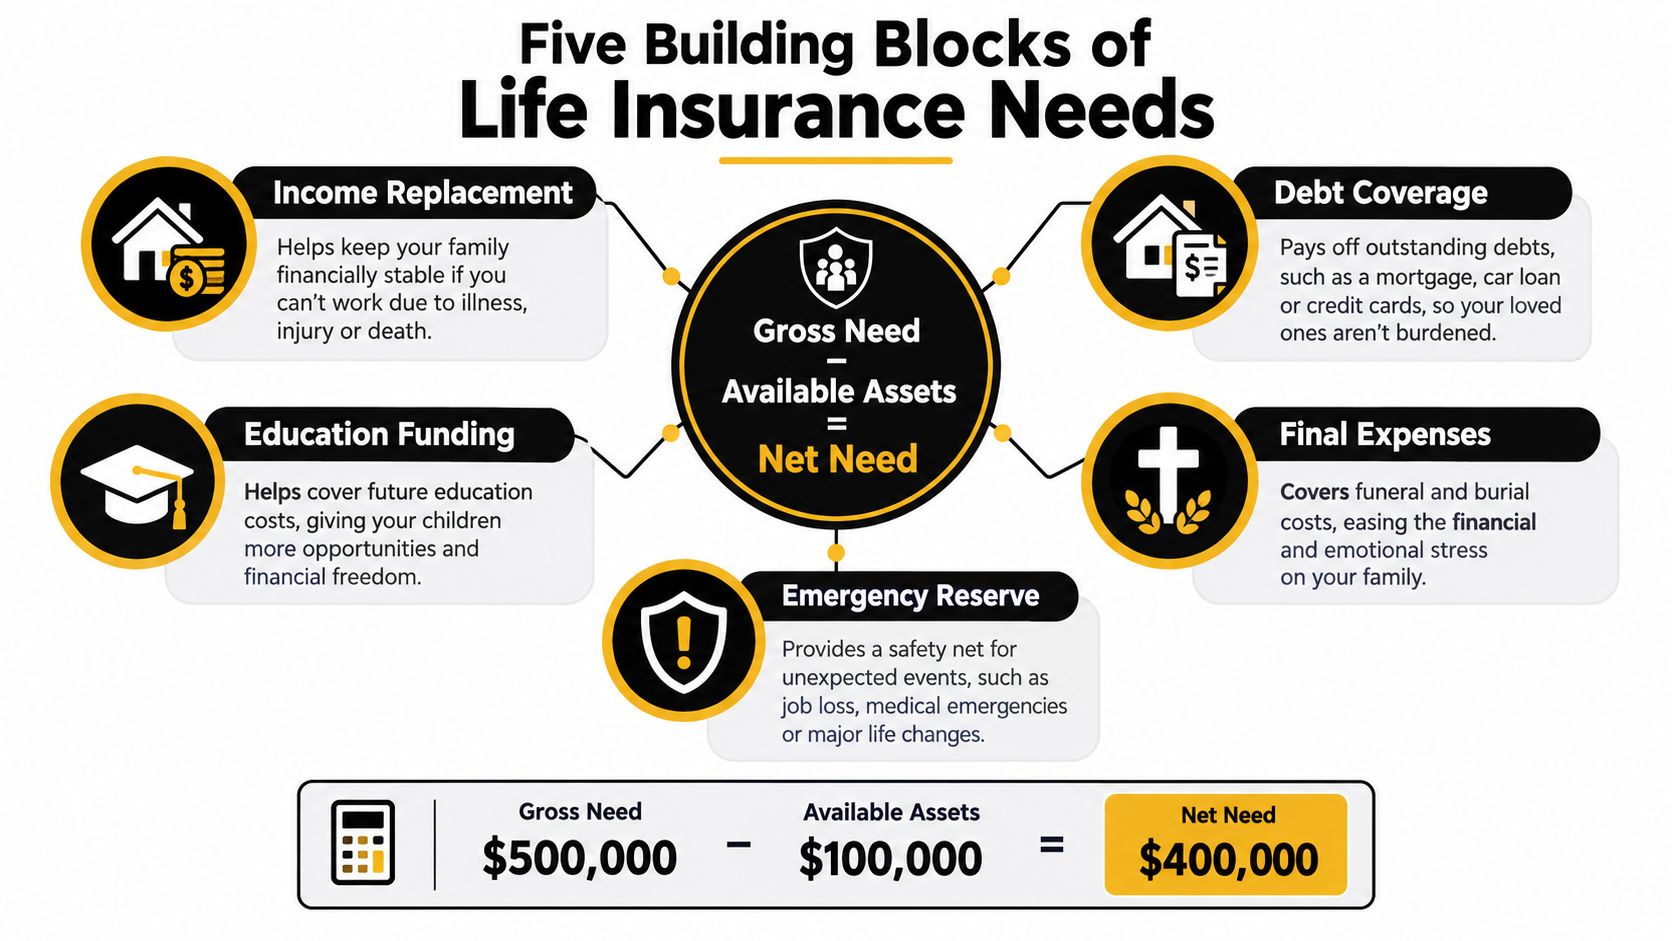
The five building blocks
Use these categories to make the calculation visible:
- Income replacement: Estimate the share of household income survivors would need and how long support should continue. One worksheet uses 60% to 75% of total household income as a common planning range for maintaining a standard of living after a death. Actual expenses and the surviving partner's earnings may point to a different amount, as shown in this Synovus life insurance needs analysis worksheet.
- Debt payoff: List personal loans, credit balances, and applicable student debt that would remain.
- Mortgage: Include the balance if the family wants the death benefit to remove the housing obligation. Keeping the mortgage and using insurance for ongoing cash flow is another possible choice.
- Education funding: Set an intended amount for each child's education. Public university costs may be about $25,000 to $30,000 per year, while private university costs may be about $50,000 to $60,000 per year, according to MoneyGeek's life insurance calculator guidance.
- Final expenses: A separate reserve can reduce the need to sell investments or borrow during a difficult period. One estimate places median funeral and burial costs at $8,300.
The timing of each need also matters. A dollar required immediately is not equivalent to a dollar needed years later. A present-value model converts future cash-flow needs into a current lump sum by considering inflation, expected wage growth, taxes, and the return the death benefit might earn.
That timing adjustment explains why the same family can receive different answers from an income multiple, DIME, or human life value calculation. A quick calculator offers a starting point, while a worksheet helps test assumptions such as two earners, different child dependency periods, retirement assets, or unpaid caregiving. The goal is a defensible coverage target first, followed by a decision about term, permanent, or combined coverage.
Comparing the Three Most Common Calculation Methods
The same household can receive different estimates depending on the method used. That doesn't mean one calculation is automatically wrong. Each method answers a slightly different question, from “What salary multiple feels reasonable?” to “What lump sum would fund the household's projected shortfall?”
Method one uses an income multiple
The multiple-of-income approach multiplies annual earnings by a selected factor. It's fast, easy to explain, and useful when a family needs a rough starting point.
Its weakness is omission. A flat 10x income shortcut may understate or overstate need when the surviving spouse earns income, children have different support periods, or the household has a mortgage and substantial assets. It also doesn't show whether the result funds education, debt repayment, or final expenses.
Method two uses DIME
The DIME method adds four categories: Debt, Income, Mortgage, and Education. Some calculators use an income replacement period of about 5 to 10 years, and education is often estimated per child, as shown by this DIME life insurance calculator.
DIME is more transparent than a simple multiplier because it forces you to name major obligations. It still may produce a gross figure if you don't subtract savings, existing life insurance, employer coverage, or other resources.
Method three uses human life value
The human life value method focuses on the economic value of the insured person's future contributions. It considers current and expected earnings, taxes, living costs, benefits, and an assumed investment return. This makes it useful when income replacement is the central goal.
It can be less complete for households that need specific lump sums for education, debt, or final costs. It also needs thoughtful treatment of a stay-at-home parent, whose unpaid childcare and household work may not appear in salary data.
| Method | How It Calculates | Best For | Watch Out For |
|---|---|---|---|
| Income multiple | Applies a chosen multiple to annual income | A quick baseline | It can ignore assets, debts, family structure, and changing income |
| DIME | Adds Debt, Income, Mortgage, and Education | Families with clear obligations | It may not subtract available resources or model present value |
| Human life value | Estimates the financial value of future contributions | Income-focused planning | It may underrepresent caregiving and specific survivor goals |
For a complex family, the strongest approach is usually a present-value income replacement model. Estimate the annual shortfall, account for the support horizon, discount future needs using a real rate of return, and subtract liquid assets and existing coverage. Technical guidance on this approach is available in this present-value life insurance planning paper.
Worked Examples That Show the Math in Real Life
Worked numbers show why the same household can receive different answers from an income multiple, DIME, or present-value analysis. The examples below use stated assumptions to show which inputs move the result. They are not personal recommendations. A real calculation should reflect the household's cash flow, assets, taxes, and goals.
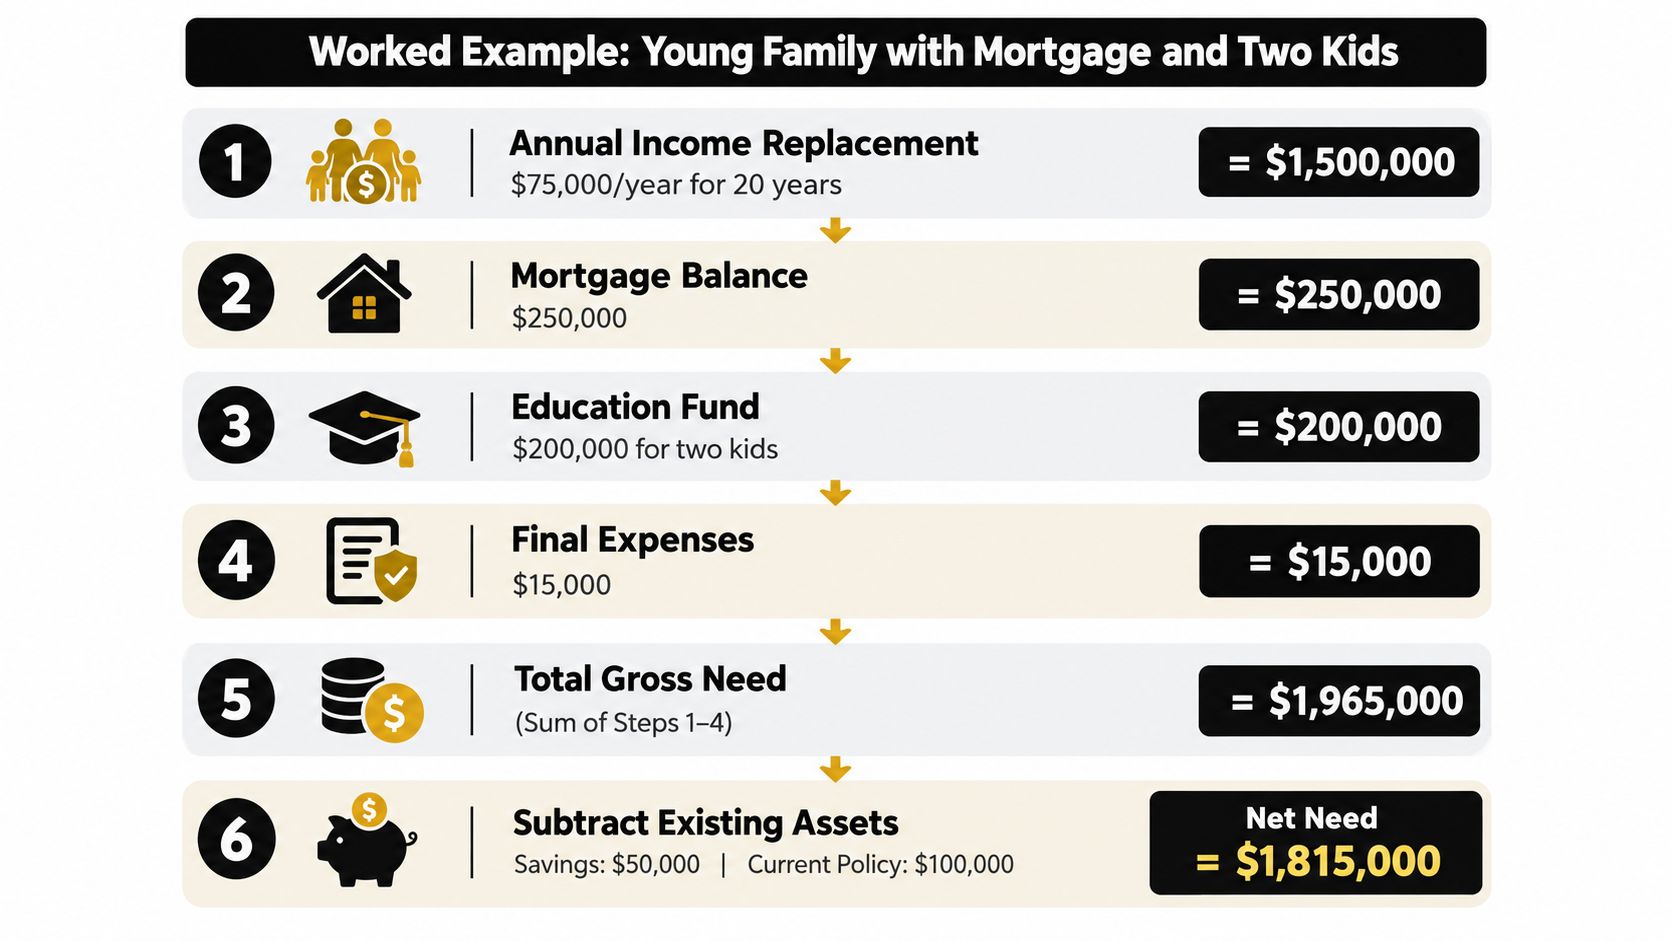
Example one shows why the shortcut changes
Suppose a dual-income family has a mortgage, two children, and an annual income replacement target of $75,000 for 20 years. A simple income multiple might produce a very different result depending on the multiple selected. It also hides how income support, debt, education, and final expenses fit together.
A needs-based calculation works like a bucket of obligations:
- Income replacement: $75,000 × 20 years = $1,500,000.
- Mortgage balance: Add $250,000.
- Education fund: Add $200,000 for two children.
- Final expenses: Add $15,000.
- Gross need: $1,500,000 + $250,000 + $200,000 + $15,000 = $1,965,000.
- Available resources: Subtract $50,000 in savings and an existing $100,000 policy.
- Net need: $1,965,000 minus $150,000 = $1,815,000.
The education and final-expense assumptions should be adjusted to the household's actual plans and preferred reserve. Change either input by $10,000, and the gross need changes by the same amount before savings and existing coverage are deducted.
The arithmetic is intentionally straight-line. A present-value model treats future income needs more like installments than one large bill. It discounts those future needs and can adjust for inflation, wage growth, taxes, and investment returns, so its answer may differ from $1,815,000.
Example two shows the effect of existing resources
Now consider a single-income household with a $120,000 gross obligation for income support, $80,000 of debt and other immediate needs, and $60,000 earmarked for education. The gross need is:
$120,000 + $80,000 + $60,000 = $260,000.
The household has $40,000 in liquid savings and $75,000 of existing life insurance. Those resources reduce the new coverage gap:
$260,000 minus $115,000 = $145,000 net need.
The useful comparison is between gross obligations and net coverage. Savings and current insurance reduce the amount a new policy may need to provide. Debt and education goals increase it. A calculator that leaves out either side can point the family toward the wrong coverage target.
For a visual explanation of the calculation process, review the following video:
Needs Analysis for Business Owners and Diverse Households
A household doesn't need to match a traditional family structure for life insurance planning to work. The analysis follows the responsibilities people carry.
A small-business owner may need personal income replacement plus business protection. If the owner's death would disrupt operations, the company might need funds to recruit or retain a replacement. A buy-sell arrangement may also require liquidity so surviving owners can purchase the deceased owner's interest. Business debt personally guaranteed by the owner can create another obligation for the family or company.
Owners can explore the planning considerations in Coveredly's life insurance for small business owners resource, then separate personal and business needs rather than placing every obligation into one undifferentiated number.

A stay-at-home parent presents a different challenge. Their contribution may not appear as income, but replacing childcare, transportation, meal preparation, household management, and other services can require substantial money and time. The analysis should estimate the cost of replacing those responsibilities, not assign a value of zero.
Women, middle-income families, and younger households can also have meaningful protection gaps. LIMRA's 2026 Barometer estimates that 92 million U.S. adults have a life insurance need-gap, with the gap highest among households under $50,000, Gen Z, Black and Hispanic Americans, and women, according to the 2026 LIMRA Barometer member toolkit.
Employer coverage deserves careful review. It may be useful, but a job change can affect whether that protection remains available or portable. List it separately, confirm its amount and terms, and avoid treating it as the only foundation for a long-term household plan.
How to Stress Test Your Coverage With Scenario Planning
A single coverage number depends on assumptions. Scenario planning shows what happens when those assumptions change, so you can avoid building a plan that works only under perfect conditions.
Start with the income gap. Ask how the result changes if the surviving spouse works more, works less, loses a job, or returns to work after caring for children. Then vary the support period. Children may need different levels of assistance, and a household might choose to fund education while also preserving retirement assets.
Run these checks
- Inflation: Test whether future expenses require a larger nominal benefit.
- Wage growth: Consider expected salary changes instead of freezing income at today's level.
- Education costs: Revisit the amount and timing of education funding.
- Investment returns: Test a lower return on the death benefit, particularly if survivors may need to draw on principal during a downturn.
- Family changes: Recalculate after marriage, a new child, a home purchase, divorce, or a spouse returning to work.
- Asset availability: Separate liquid resources from retirement accounts or property the family may not want to sell.
A flexible policy design can also matter. Some families use a term ladder so coverage declines as debts fall and children become independent. The Coveredly guide to laddering term life insurance can help explain that design choice.
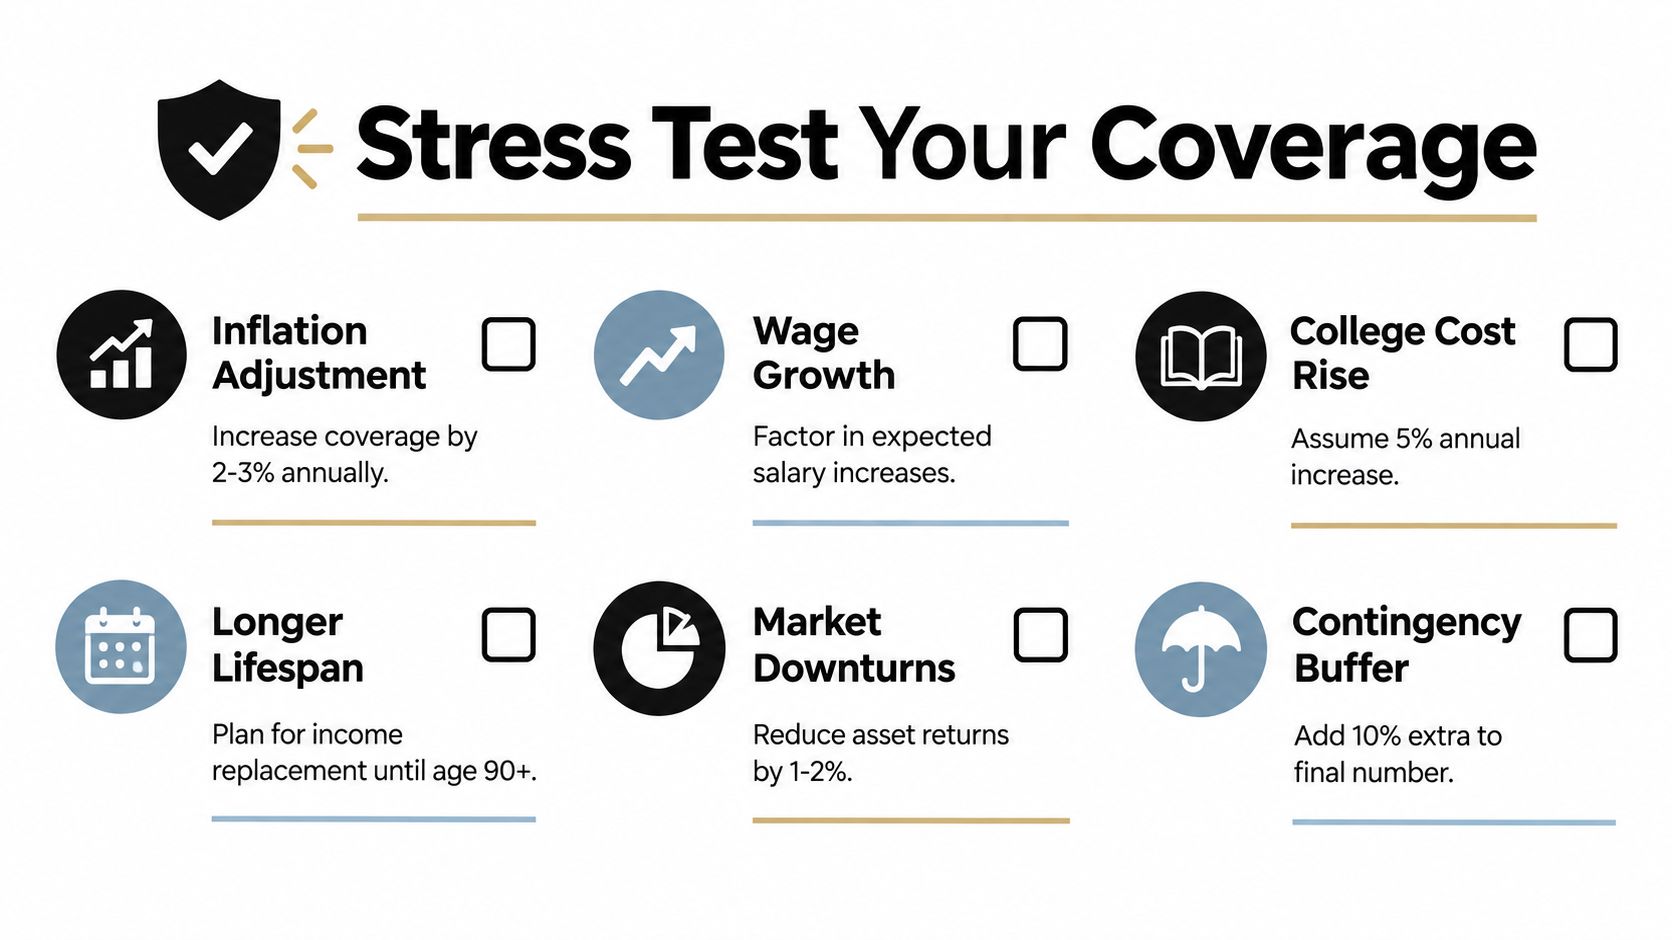
Stress-test question: If one assumption changes, does your family still have enough liquidity to keep its most important commitments?
Keep the analysis current. Review it periodically and whenever income, debt, dependents, employment benefits, or major goals change. You don't need to rebuild the entire plan from scratch every time, but you should update the inputs that drive the gap.
Your Life Insurance Needs Analysis Worksheet and Next Steps
Use this fill-in worksheet to turn a vague coverage question into a visible calculation. Gather a recent pay statement, mortgage balance, loan statements, savings balances, and current policy documents before filling in the blanks.
List the obligations
- Debt: Credit cards, student loans, personal loans, and other balances: $________
- Income replacement: Annual support needed: $________ × support years: ________ = $________
- Mortgage: Balance to repay, if applicable: $________
- Education: Target amount per child: $________ × children: ________ = $________
- Final expenses: Planned reserve: $________
- Other household or caregiving costs: $________
Add these figures:
Gross need: $________
Subtract available resources
- Liquid savings: $________
- Existing personal life insurance: $________
- Employer coverage you've verified: $________
- Other usable resources: $________
Then calculate:
Gross need minus available resources = estimated net need of $________
This worksheet is a starting point, not a prediction. A more rigorous present-value model can adjust future cash flows for inflation, wage growth, taxes, and investment returns. Use the Coveredly life insurance online calculator to organize the estimate, then consider whether the term length matches the longest obligation, such as a mortgage or dependent's education timeline.
Coveredly offers digital term life insurance, with up to $3 million of coverage and no exams for most applicants, according to the publisher's product information. Complete the worksheet, update it after major life changes, and compare the result with the coverage you already have before applying.
Complete your life insurance needs analysis today, verify your existing coverage and beneficiaries, and use the result to request a personalized quote. Visit Coveredly to explore a digital term life insurance option that can fit your household's actual protection gap.